What is a Flowchart?
A flowchart is a diagram that represents a process, system, or algorithm. It uses various symbols to denote different types of actions or steps in a sequence.
By visualizing a process in this way, flowcharts help individuals understand, analyze, and improve workflows.
Why use a flowchart?
Flowcharts provide a visual representation of a process, making it easier to follow and understand complex procedures.
They are used in various fields, from business and engineering to computer science and project management.
The primary purpose of a flowchart is to illustrate how a process works in a clear and concise manner and is a basic process map.
Benefits of using flowcharts
Flowcharts offer numerous benefits, including:
- Clarity: They simplify complex processes and make them easier to understand.
- Communication: Flowcharts improve communication by providing a clear visual representation of a process.
- Problem-Solving: They help identify bottlenecks and inefficiencies in a process.
- Documentation: Flowcharts serve as effective way to document processes and procedures.
- Training: They are useful in training new employees by providing a visual guide to workflows.
Types of Flowcharts
Flowcharts come in various types, each serving different purposes:
Process Flowcharts
Process flowcharts, or process diagrams, illustrate the steps involved in a particular process.
They are commonly used in business and industrial settings to analyze and improve processes.
For example, in manufacturing, they can illustrate the steps involved in producing a product, from raw materials to the finished item. In service industries, they can map out the customer journey, identifying critical touchpoints and areas for improvement.
In addition to process flowcharts, user journey mapping is another essential tool for visualizing user interactions and emotions across various touchpoints. You can explore more about user journey mapping here.
The one below shows a path of data collection for financial reporting.
System Flowcharts
System flowcharts depict the flow of data or the steps involved in a system. These are often used in software development and IT to design and document systems.
System flowcharts are a type of data flow diagram that helps visualize the movement of data within a system.
System flowcharts are essential in software development and IT.
They help visualize the flow of data through a system, making it easier to understand complex data structures and interactions.
For instance, a system flowchart can map out how user input is processed and stored in a database, helping developers optimize system performance.
Here’s one by Zen Flowchart showing profit/loss calculations:
Swimlane Flowcharts
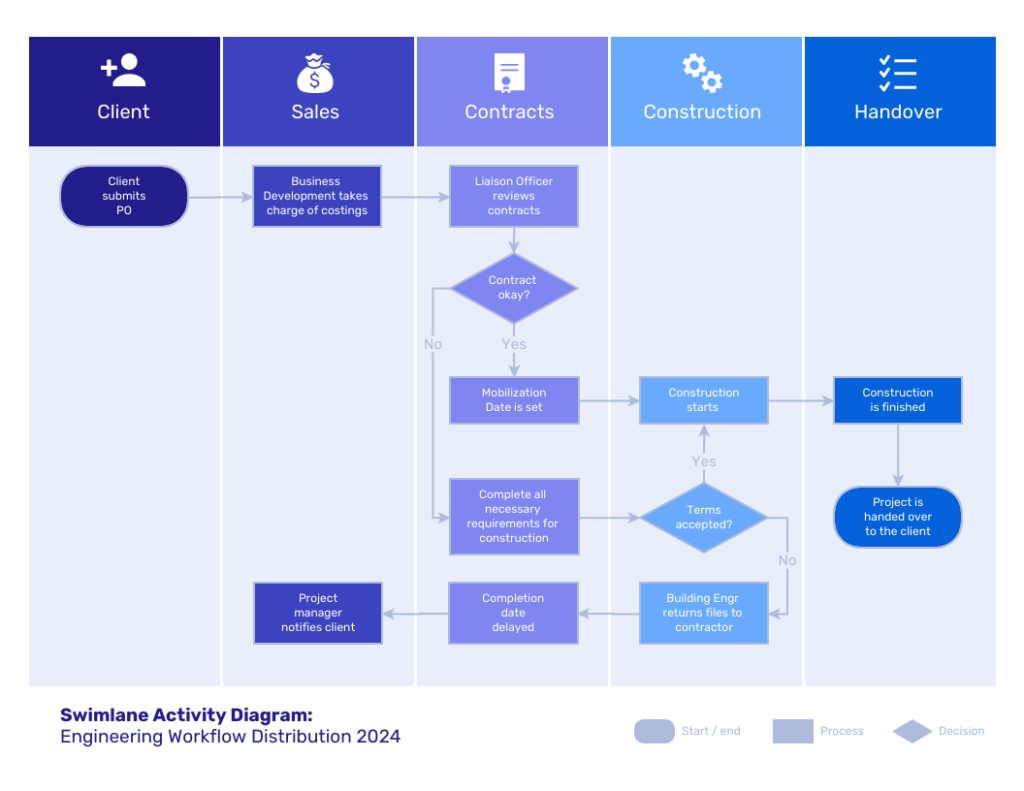
Swimlane flowcharts, or cross-functional flowcharts, divide the process into lanes, with each lane representing a different department or team.
This type of flowchart is useful for identifying which team or department is responsible for each step of the process.
Swimlane flowcharts are particularly useful in organizations with complex workflows involving multiple teams or departments.
By dividing the process into lanes, these flowcharts clarify responsibilities and improve coordination.
For example, a swimlane flowchart can illustrate the steps involved in a product development process, showing how different teams contribute to the overall project.
The one below shows the roles and responsibilities in a construction agreement (source).

Symbols Used in Flowcharts
Understanding the symbols used in flowcharts is crucial for creating and interpreting them accurately. Here are some of the most common symbols:

Oval or Terminal (Start/End Symbol)
The oval symbol indicates the start and end points of a process.
Rectangle (Process Symbol)
The rectangle represents a process or action step. This shape is one of the most frequently used in process flow charts and process flow diagrams.
Diamond (Decision Symbol)
The diamond symbol denotes a decision point in the process, where a yes/no question is asked. This shape is essential in decision flowcharts, which map out various decision points in a process.
Flow Line (Arrow Symbol)
Arrows indicate the flow of the process, showing the direction from one step to the next.
Detailed History of Flowcharts
Origin of Flowcharts
Flowcharts have their roots in the early 20th century. The concept of process diagrams was first introduced by Frank and Lillian Gilbreth, American engineers and pioneers in the study of motion and time. Here’s a copy of their original paper to the American Society of Mechanical Engineers.
They used flowcharts to study and improve work processes, aiming to find the most efficient ways to perform tasks.
Another significant figure is Allan H. Mogensen, who popularized flowcharts in the business world through his training programs in work simplification.
Throughout the 20th century, flowcharts evolved significantly. In the 1940s, they became a common tool in the fields of industrial engineering and operations research. By the 1960s, flowcharts were widely adopted in computer science for software development and algorithm design.
Advanced Symbols and Their Uses
Introduction to More Specialized Symbols
In addition to the basic symbols, there are several specialized symbols used in flowcharting:
- Document Symbol: Represents a document or report.
- Data Symbol: Indicates data input or output (e.g., user input).
- Database Symbol: Represents a database or data storage.
- Manual Operation Symbol: Indicates a manual process step.
- Preparation Symbol: Denotes a preparation step or initialization.
Explanation of Complex Flowchart Elements
Advanced flowcharts may include complex elements like sub-processes, loops, and parallel processing. These elements help depict more sophisticated workflows and algorithms:
- Sub-Process: A complex process that can be broken down into smaller steps, represented as a separate flowchart.
- Loop: Indicates repetitive steps in a process, such as a for loop in programming.
- Parallel Processing: Shows multiple processes occurring simultaneously, often represented with parallel lines or branching paths.
Comparing Flowcharts with Other Diagramming Tools
Differences Between Flowcharts and Other Visual Tools
Flowcharts are one of many diagramming tools used to visualize processes. Here are some key differences between flowcharts and other common visual tools:
- Mind Maps: Mind maps are used for brainstorming and organizing ideas. They have a radial structure, unlike the linear flow of flowcharts.
- Gantt Charts: Gantt charts are used for project scheduling, showing tasks and timelines. They focus on time management rather than process flow.
- Org Charts: Organizational charts depict the structure of an organization, illustrating hierarchies and relationships. They do not represent processes.
Advantages and Disadvantages of Using Flowcharts
Advantages:
- Clear visual representation of processes.
- Easy to understand and communicate.
- Helps identify inefficiencies and areas for improvement.
Disadvantages:
- Can become complex and hard to manage for very large processes.
- May require frequent updates as processes change.
- Limited in representing non-linear relationships and interactions.
Common Mistakes and How to Avoid Them
Typical Errors Made While Creating Flowcharts
Common mistakes in flowcharting include:
- Overcomplicating the Flowchart: Adding too many details can make the flowchart hard to read.
- Inconsistent Symbols and Formatting: Using different symbols for the same type of action can confuse viewers.
- Neglecting Decision Points: Omitting decision points can lead to an incomplete representation of the process.
Tips on Troubleshooting and Correcting These Errors
- Simplify: Focus on the key steps and avoid unnecessary details.
- Standardize: Use consistent symbols and formatting throughout the flowchart.
- Review and Test: Walk through the flowchart step-by-step to ensure it accurately represents the process.
Interactive and Digital Flowchart Tools
Review of Various Digital Tools
Several digital tools are available for creating flowcharts, each offering unique features and benefits:
- Lucidchart: A versatile online tool for creating flowcharts, diagrams, and other visual representations. It offers a wide range of templates and collaborative features.
- Microsoft Visio: A popular software for professional flowcharting and diagramming. It provides advanced features for creating detailed and complex flowcharts.
- Miro: An online collaboration tool with flowchart capabilities. It is ideal for remote teams and offers real-time collaboration features.
Flowcharts in Modern Business Practices
Role of Flowcharts in Agile and Lean Methodologies
Flowcharts play a significant role in Agile and Lean methodologies by providing visual representations of workflows and processes. In Agile, flowcharts help teams understand user stories, plan sprints, and track progress. In Lean, they are used to map out value streams, identify waste, and improve process efficiency.
Use in Project Management and Business Process Optimization
In project management, flowcharts are used to plan and manage project tasks, ensuring that all steps are clearly defined and executed in sequence.
They help project managers visualize dependencies, allocate resources, and track project progress. In business process optimization, flowcharts identify inefficiencies and areas for improvement, enabling organizations to streamline operations and enhance productivity.

Get more info about processes & documentation from Tettra
How Flowcharts Can Be Added to Knowledge Management Software Like Tettra
Integrating flowcharts into knowledge management software like Tettra can enhance the organization’s ability to document, share, and optimize processes.
You can link or embed any flowcharts into Tettra, and then quickly find and reference them alongside your other docs.
Enhancing Documentation with Flowcharts
Flowcharts can be embedded in Tettra pages to provide visual documentation of processes. This helps team members understand workflows at a glance and ensures that everyone follows the same procedures. Using chart templates in Tettra can standardize documentation and make it easier to create consistent process flow diagrams.
Streamlining Onboarding and Training
Using flowcharts in Tettra can streamline onboarding and training processes.
New employees can easily follow visual guides to understand their roles and responsibilities, reducing the learning curve and improving efficiency. Workflow diagrams and process charts are particularly effective in training settings.
Improving Collaboration and Process Optimization
Flowcharts facilitate better collaboration by clearly defining each step of a process and the responsible parties.
Teams can use Tettra to collaboratively edit and improve flowcharts, ensuring that processes are continuously optimized. A flowchart tool integrated into Tettra can allow for real-time collaboration and updates.
Examples of Using Flowcharts in Tettra
- HR Onboarding Process: A flowchart in Tettra can outline the steps new hires need to complete, from paperwork submission to meeting with their manager.
- Customer Support Workflow: A flowchart can illustrate the steps support agents need to follow when handling customer inquiries, ensuring consistent and efficient service.
- Product Development Cycle: Teams can use flowcharts to map out the product development process, from ideation to launch, ensuring all steps are clearly defined and followed.
Start your knowledge base with Tettra today and add your flowcharts.


