What is business process mapping?
A process map, also known as a flowchart or process flow diagram, is a crucial planning and management tool that gives you a clear picture of how work flows within a company.
It shows a series of steps that, when put together, lead to a desired outcome. You can use process mapping software to create these maps, making it easy to understand the different steps involved.
Business process mapping covers various aspects of business activities, including what needs to be done, the standards for success, who does what, and when and where each step happens.
This way of creating visual representations, a key part of business processes, promotes openness within the company and among all stakeholders, especially those who need to ensure compliance.
Importance of process mapping in business
A business process map…
- Offers useful insights into various processes
- Encourages teams to work together to come up with ideas to improve how things are done.
- Improves communication
- Serves as documentation to add to your knowledge base
Through process mapping, you can pinpoint bottlenecks, identify repetitions, and uncover delays. It goes further by setting clear boundaries, making sure everyone knows who’s responsible for what, and establishing metrics to see how well things are going.
This becomes a handy tool for organizations looking to make their operations smoother and improve their performance.
Level 1 Process Map
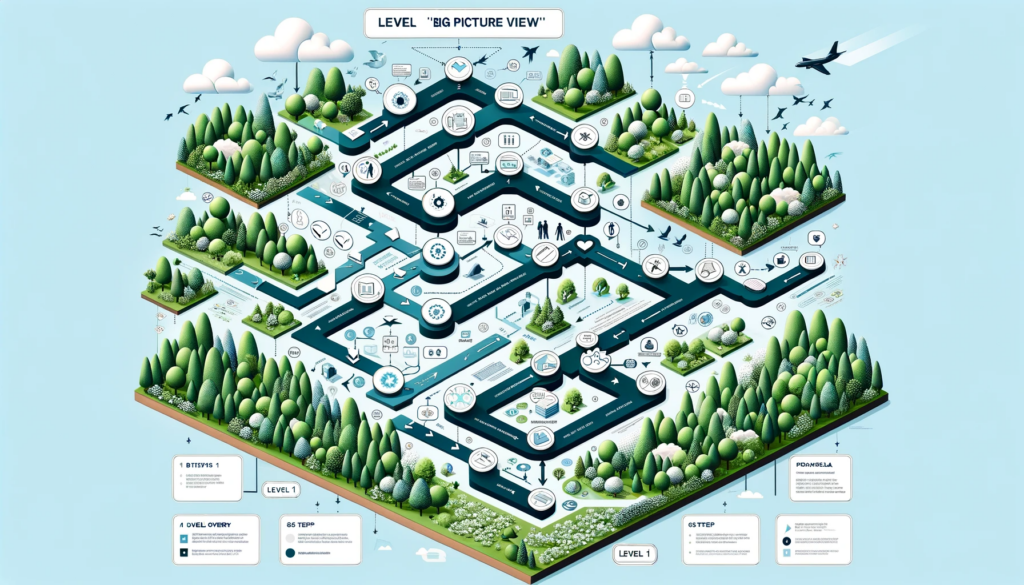
Let’s start with a Level 1 Process Map, which can be referred to as the “big picture view.”
A Level 1 Process Map gives you an overview of the process at its highest level, usually with five to seven key steps. Imagine it as getting a bird’s-eye view of an entire forest. It’s like when you’ve seen a forest from a plane or a mountaintop.
Creating a Level 1 Process Map means getting up high enough to see the whole scene without the trees blocking your view.
These Level 1 maps are like storytelling tools, showing you “what” is happening in a process. They’re great for giving you a high-level understanding without diving into minute details. What makes Level 1 Process Maps special is their universal clarity. They’re designed to be grasped by anyone in the organization without needing any specific training.
A quick look at the map should let you comprehend the process, offering insight into where it begins and ends, along with a clear view of inputs and outputs.
Here’s a sample Level 1 process map:
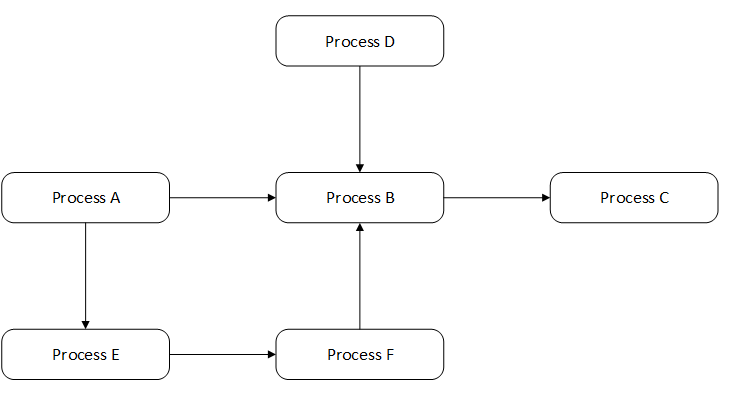
Source: University of Leeds
Despite their apparent simplicity, Level 1 maps can be tricky because you may be eager to jump into the “how” of a process before fully understanding the “what.”
It’s a common pitfall for new process mappers. Investing time in understanding “what” is happening proves invaluable when you eventually delve into the crucial “how” of execution.
It’s a high-level overview where you understand the key stages without diving into detailed procedures.
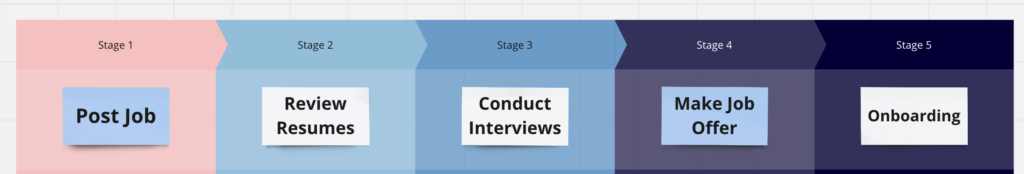
For example, if you look at recruiting, you’d outline the major steps like posting a job, reviewing resumes, conducting interviews, making a job offer, and onboarding.
The steps may look like this:
Post Job -> Review Resumes -> Conduct Interviews -> Make Job Offer -> Onboarding
And then the process map may look like this. You can see there are multiple ways of illustrating a process.
Level 2 Process Map
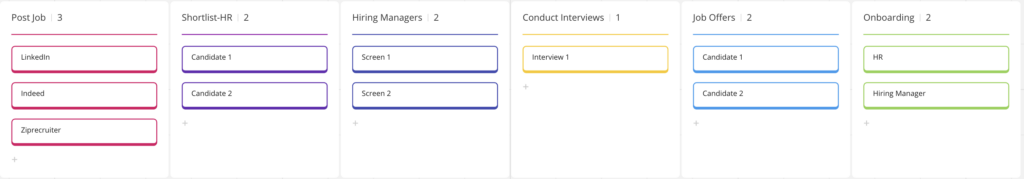
Level 2 maps offer a closer look at the process, highlighting the relationships between different team members and the tasks they perform.
As you go deeper into Process Mapping, it’s important to understand the uses of a few simple symbols. Keep your Process Mapping symbols straightforward—while there are many options, the activity box and the decision box usually get the job done.
The activity box, shaped like a rectangle, is where you write the activity using a verb/noun combination. On the other hand, the decision box, a diamond shape, has one entrance and two exits. A question is always posed within the box, determining the direction the process will take based on the answer (Yes/No, Go/No-Go, etc.).
Level 2 maps shift the focus to “who does what.” They are useful in showing the connections among team members necessary to transform inputs into outputs. This understanding is key in breaking down communication silos. Consider Level 2 process maps as tools that help individuals see how their work aligns with others.
In the case of our recruiting example, you may identify activities like HR posting the job, hiring managers reviewing resumes, and interview panels conducting interviews. Symbols like activity boxes (representing actions) and decision boxes (for choices like hire or not) could be used.
Level 3 Process Map
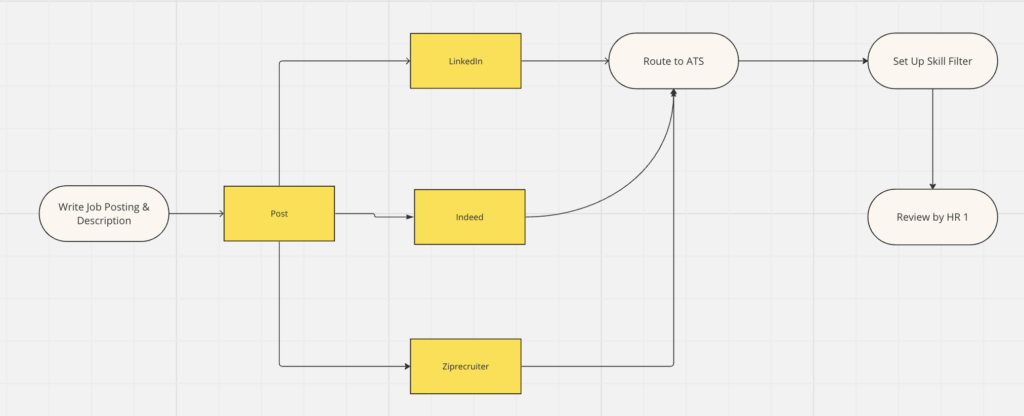
Level 1 and Level 2 Process Maps give an overview of the process and explore the details of “who does what?” Level 3 Process Maps highlight the “How?” in business processes.
Building on the symbols introduced for Level 2, Level 3 maps continue to use the activity and decision boxes. These maps offer a detailed view, revealing the specifics of “how” work is done.
They’re super helpful for team members in the trenches, giving clear instructions on turning inputs into outputs for immediate customers.
Level 3 maps, also known as flow charts, are commonly used for training, onboarding, and departmental improvement exercises. Each Level 3 map corresponds to a “who” identified in the Level 2 map, laying out the precise steps for converting inputs to outputs.
It’s important to note that Level 3 processes must be done well to achieve overall objectives. However, there’s a challenge known as sub-optimization, where processes are optimized at a sub-level without considering the broader context of Levels 1 and 2. While Level 3 maps might seem like the main focus of process discussions, their effectiveness ultimately depends on the foundational understanding provided by Level 1 and 2 maps. Without grasping the “what” of the process, the “how” loses its significance in terms of improvement.
In our example, Level 3 would involve detailing specific steps like crafting job descriptions, using structured interview techniques, and creating a seamless onboarding experience.
This level provides clear instructions, resembling a flow chart that can be used for training and improvement initiatives.
This is still a simple Level 3 process map, but you can see a few more details. You would repeat this level of detail for each of your steps in Level 2.
What are the types of process maps?
You can make business process maps for project plans, details, documents, products, roles, locations, strategies, or interactions, at different levels of detail. A mapping or process documentation tool
can help you put these together.
Here are the five most common types of business process maps.
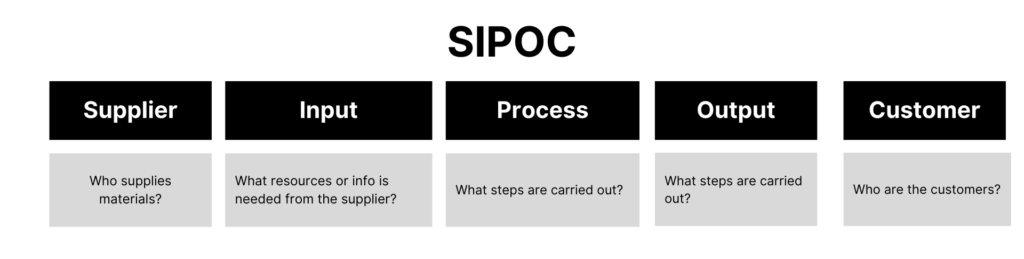
High-level Process Map
It is a simple way to show a process overview by using the Supplier, Input, Process, Output, Customer (SIPOC) framework.
This framework gives a clear look at how different parts work together in a process. The Supplier is where things start, followed by the Input, which is what the process begins with.
The Process is the series of steps taken, leading to the Output. The Customer is the one who gets that output. SIPOC gives the main interactions within a process without going into details.
Detailed Process Map
A Detailed Process Map takes a closer look at each step in the process, providing more in-depth information.
Value Stream Map
Value-stream mapping (VSM) is about drawing out every step in the material and information flows needed to get a product from order to delivery.
This tool is commonly used in efforts to continually improve by finding and getting rid of any unnecessary steps or processes, ultimately cutting down on waste.
It may look like something like this:
Workflow Diagrams
Workflow diagrams are a specific kind of flowchart made for business processes and workflows. They follow a linear and chronological structure, allowing you to see the steps of a process in the right order. These diagrams use specific symbols and shapes to clearly outline what is required for each step.
Flow Diagrams
A Process Flow Diagram (PFD) is like a flowchart that shows how major components are connected in a business process. While it’s commonly used in chemical and process engineering, its principles can also be applied to various other processes.
Get more info about processes & documentation from Tettra
- 15 best online documentation tools
- What is process mapping?
- The top process documentation tools
- Why you need project documentation
- How to build effective product documentation
- How to document your processes
- The types of business process documentation you need
- How good team documentation boosts productivity
Steps in Process Mapping
Step 1: Identify the process you need to map
Start by understanding where you want to begin.
- Is it with a process that’s not doing well?
- Is it with a process vital to your new strategy?
- Or is it with a process that directly affects customer satisfaction?
Outline the result of the process map and then give it a name.
Step 2: Defining the objectives and scope of the process
Start by listing down all the things you need to do to finish the process. Don’t worry about the order right now. Just make a list of all the activities and who is responsible for each.
It’s a good idea to work together with your teammates and other folks involved in the process. This way, you can make sure you capture the scope of the process and decide on how much detail you need. Also, be clear about where the process starts and ends, so you know which tasks help you get the result you want.
Step 3: Gathering data and understanding the current process
In this step, the goal is to collect all the information you can. This is where you’ll truly get a handle on how things work in your process. Figure out what people do, why they do it, how much time it takes, and what resources they need. Whether you follow employees around or have chats with them to gather the info, make sure to jot it down.
Step 4: Documenting the process steps and activities
Now that you’ve got a list of all the things you need to do, the next step is to put them in the right order until the whole process is laid out from start to finish. This is a good time to check if there’s anything you might have missed in the previous step. Here’s what it would look like in a hiring process.
- Get a job application
- Check out the application
- Have interviews with three different candidates
- Pick the best candidate
- Send the candidate’s info and offer details to the hiring manager for approval.
- If it’s a go, send the job offer to the candidate and start onboarding; if not, let the candidate know.
- Wait for the new employee to start
- Evaluate how onboarding went and the candidate’s experience
Step 5: Mapping the flow of the process using symbols and notation
Incorporate all the information you gathered in the previous steps and use process symbols to create the process map. For example, use a rectangle (activity) to represent the start of the process. Make sure it accurately reflects how the process currently works.
Step 6: Analyzing bottlenecks and areas for improvement
Once you’ve made sure the process map shows how things work, it becomes a handy tool to look for ways to make the process better.
Talk to your team to find where things slow down and aren’t working well. What steps can be cut? Where can tasks be done more easily? Once you’ve figured out these areas to make things better, take action to fix them and update the process map to show the improvements.
Mapping out processes is essential for ramping up productivity in organizations. By visually showing how things get done, it gives a clear picture of tasks, helping spot and cut out bottlenecks and inefficiencies. This process also helps to keep things standardized, making sure everyone follows the best practices. As a result, teams work together better, decisions are based on data, and productivity gets a real lift.
How to use Tettra with your process maps
Let’s be clear.
Tettra is not a dedicated process-mapping tool, but you can easily store all of your process maps in Tettra.
You could upload images or PDFs into Tettra with your other company docs, creating a searchable internal knowledge base for all of your processes and information.
You can also link out to process maps in your other tools, such as in Miro, Mural, Lucidchart or Figma. Then you can search the titles within Tettra and find them quickly.
For instance, a Level 1 Process Map can be documented within Tettra, providing a visual and easy-to-understand reference for your team. This approach not only helps in preserving critical process knowledge but also in disseminating it efficiently across various departments.
Moreover, utilizing Tettra’s AI-powered features and integrations with tools like Slack and MS Teams, these process maps can be easily accessed and referred to, enhancing collaborative efforts and decision-making processes.
The simplicity and clarity of process maps align well with Tettra’s aim to offer a user-friendly and efficient knowledge management experience.