
Effectively managing a customer service team demands substantial resources and effort. But how can you gauge the effectiveness of these investments?
While gut feeling can sometimes be helpful when making business decisions, it’s not the most reliable approach for managing your customer service team. Relying on vague feelings or unverified metrics does very little to help you develop and implement effective customer support strategies or gain buy-in from stakeholders.
That’s why you need more reliable methods to assess customer service performance. In other words, you need proven customer service metrics.
What are customer service metrics?
Customer service metrics are data points that organizations use to evaluate the effectiveness of their customer service teams, forecast hiring needs, optimize resource allocation, gain insights into customer satisfaction, and pinpoint gaps in their customer service strategies.
These metrics serve as key performance indicators (KPIs) for both individual team members and the customer service team as a whole, enabling data-driven decision-making. Based on these KPIs, you can proactively identify and tackle recurring service issues, continuously enhancing the customer experience.
Key Customer Service Metrics
While your help desk reports likely offer hundreds of metrics, each serving its own purpose, they can generally be categorized into the following groups:
- Customer satisfaction metrics
- Ticket volume metrics
- Responsiveness metrics
- Effectiveness metrics
- Self-service metrics
Let’s dive into metrics from each of these categories in more detail below.
What are the most important customer satisfaction metrics?
Customer satisfaction metrics indicate how happy customers are with your products, customer service, and overall experience. Typically, they serve as primary customer service KPIs, reflecting how well your organization does at delighting customers.
The most commonly used customer satisfaction metrics include the customer satisfaction (CSAT) score, net promoter (NPS) score, and customer effort score (CES).
1. Customer Satisfaction Score (CSAT)
The customer satisfaction score (CSAT) is a customer service metric showing the level of customer satisfaction following a specific support interaction.
Typically, customers are prompted to complete a satisfaction survey, rating their service experience on a scale of 1 to 5, immediately after an email exchange, live chat, or phone call with support.
Here’s what one from Intercom looks like:
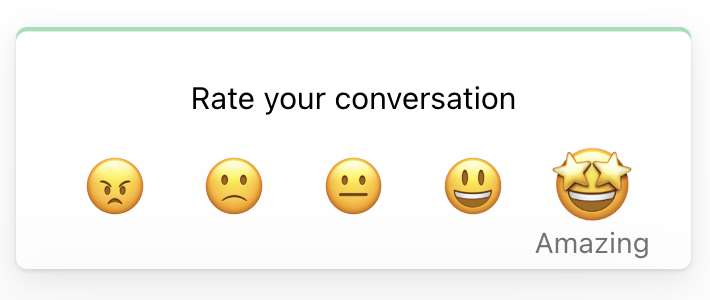
It’s important to note that while CSAT scores are intended to reflect customer happiness with the service provided, they can sometimes be influenced by product issues or company policies that the support team has no control over.
Imagine a scenario where a customer forgets to cancel their subscription and requests a refund. No matter how awesome your customer service team is, if the request is denied due to the company’s no-refund policy, it’s likely to result in a low CSAT score.
Adding a field for open-ended feedback to your CSAT survey can offer additional insights into the “why” behind low and high scores.
How to calculate the CSAT score
Your CSAT score is the percentage of satisfied customers who replied to the CSAT survey with 4 and 5 ratings.
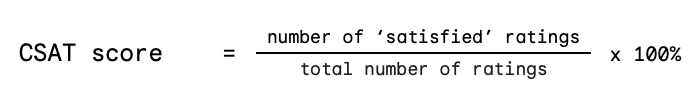
For example, if you have 6 out of 10 customers rating your service with 4 or 5, your CSAT score will be 60% (6 satisfied customers / 10 total number of responses * 100%).
Thankfully, help desk tools like Intercom, Help Scout, Zendesk, and others can automate the process and send out CSAT surveys as well as calculate the CSAT score for you.
Your CSAT score can range from 0% to 100%, with higher scores indicating better customer satisfaction. In competitive industries like SaaS and e-commerce, the benchmark hovers around 80%, and for high-performing teams, 95% CSAT can be an attainable goal.
2. Net Promoter Score (NPS)
The net promoter score is a customer satisfaction metric showing how happy customers are based on their likelihood to recommend your company to friends or colleagues.
It is used to forecast customer retention rates and evaluate customer loyalty and overall satisfaction with your product. Some companies, like HubSpot, also use it to measure customer satisfaction with the service provided.
NPS revolves around a single survey question: “Would you recommend X to your friends or colleagues?”
This is an example from Profitwell:
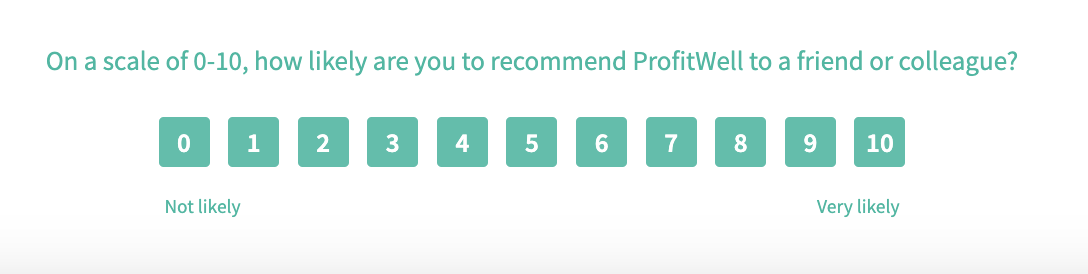
Customers rate the likelihood of recommending your company on a scale of 1-10 and fall into one of three categories based on their score:
- Detractors: Ratings from 1 to 6. These customers are dissatisfied with your product and unlikely to recommend it to others.
- Passives: Ratings from 7 to 8. They generally like your product, but not enough to actively endorse it. Since NPS focuses on customer recommendations, passives do not affect the score.
- Promoters: Ratings of 9 or 10. These customers are enthusiastic brand advocates – highly satisfied with the product, and likely to recommend it to others.
How to calculate the NPS score
To calculate NPS, you need to determine the proportion of promoters and detractors within the total ratings pool, and then subtract the percentage of detractors from the percentage of promoters.

For instance, if 4 out of 10 customers (40%) provided scores of 9 or 10, and 3 customers (30%) fell into the detractors category, your NPS would be 10, calculated as 40% promoters minus 10% detractors.
However, you don’t have to manually calculate your NPS score these days. Many survey tools like Survicate or SurveyMonkey can send out surveys and run the calculations for you.
The NPS score can range from -100 (if all customers responded with low scores) to 100 (if 100% of your customers are promoters). A higher score indicates better customer sentiment, but anything above 0 is positive, indicating a higher proportion of promoters than detractors. According to recent research by Survicate, the overall NPS benchmark is defined at 32.
As you implement improvements in your customer service processes, your NPS should ideally increase, reflecting an improvement in customer satisfaction. If the NPS decreases despite your efforts, it may signal that your improvements are not resonating well with customers. Analyzing open-ended feedback can provide further insights in such cases.
3. Customer Effort Score (CES)
Customer Effort Score is a customer service measurement indicating the ease of customer experience in support interactions. Introduced by Gartner in 2010, CES stemmed from studies showing that reducing customer effort is more effective in maintaining satisfaction, fostering customer loyalty, and generating referrals than focusing on delighting customers.
In recent years, CES has been gaining popularity as a key support KPI. Focusing on the ease of the support experience allows you to differentiate between overall product satisfaction and customer satisfaction with the support experience specifically.
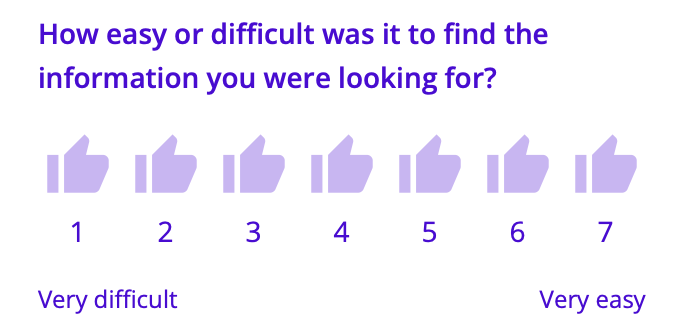
The score is based on a survey asking customers about the ease of resolving their issues when contacting support. Typically, the survey is sent immediately after a support interaction, with responses measured on a 7-point scale.
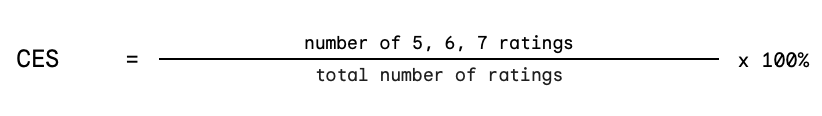
How to calculate CES score
To calculate CES, divide the number of 5, 6, and 7 scores by the total number of responses received, then multiply the result by 100%.
For instance, if 10 customers provide responses and 7 of them rate their experience as 5 or higher, your CES score would be 70%, calculated as 7 high ratings divided by 10 total ratings and multiplied by 100%.
The CES score ranges from 0% to 100%, with anything above 50% considered good. A score above 50% indicates that the majority of your customers have experienced an effortless customer service interaction with your company. By looking into open-ended feedback and cases receiving lower CES ratings, you can identify areas for improvement to provide a more effortless experience to your audience.
What are the most important ticket volume metrics?
Ticket volume metrics offer insights into your team’s workload and the state of your inboxes, empowering you to effectively manage demand, allocate resources, and forecast hiring needs.
Screenshot from Intercom
Key volume metrics include ticket count over a specific period, ticket backlog, and ticket count per customer.
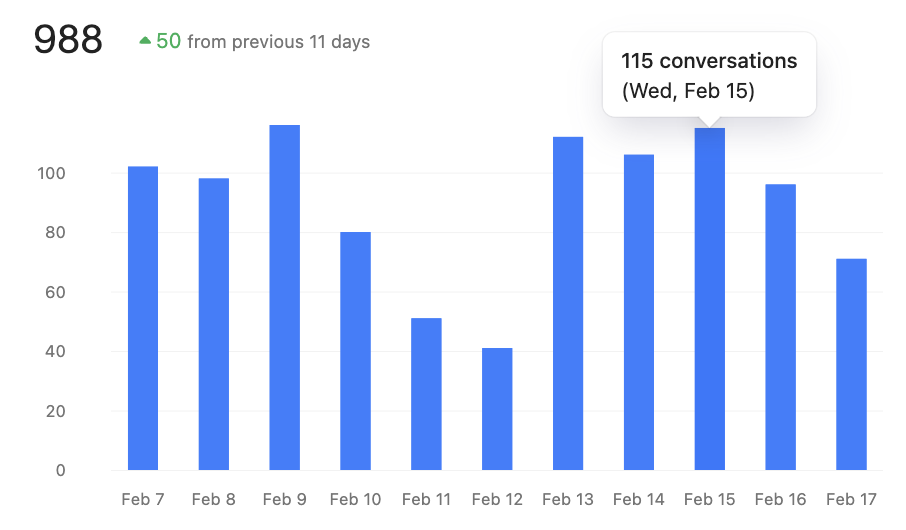
5. Ticket Count Over a Specific Period
This metric reflects every interaction your support team engages during a specified timeframe, indicating the demand on your support team. By applying filters to the overall ticket count, you can analyze various aspects, such as:
- Ticket count per channel (calls, chats, emails) for effective team capacity planning and identifying the busiest channels to optimize your support operations based on customer preferences. For instance, in response to minimal demand, my team disabled support on social media channels for B2B SaaS customers and SMS support for an e-commerce brand targeting a young audience.
- Ticket count by related product area to identify which product areas generate the most tickets and suggest product improvements. Understanding the structure of support volume is essential for managing and reducing it over time.
- Ticket volume by day of the week to gain insights into the busiest periods and allocate resources accordingly – ensuring exceptional customer service even during peak demand periods.
6. Ticket Backlog
Ticket backlog represents the number of unresolved tickets at any given time. Monitoring the backlog helps you effectively distribute resources to ensure timely resolution of customer issues.
If you manage multiple teams or channels, monitoring the backlog per team or channel helps gauge capacity and make necessary schedule or headcount adjustments.
7. Ticket Count Per Customer
Tracking average tickets per customer per month helps with forecasting ticket volume changes as your customer base increases or decreases over time.
Segmenting this metric by customer type (e.g., freemium vs. paid) and customer journey stage can help you predict hiring needs even more accurately as the customer base evolves.
What are the most important responsiveness metrics?
Responsiveness metrics provide insights into your team’s ability to promptly respond to and resolve customer inquiries.
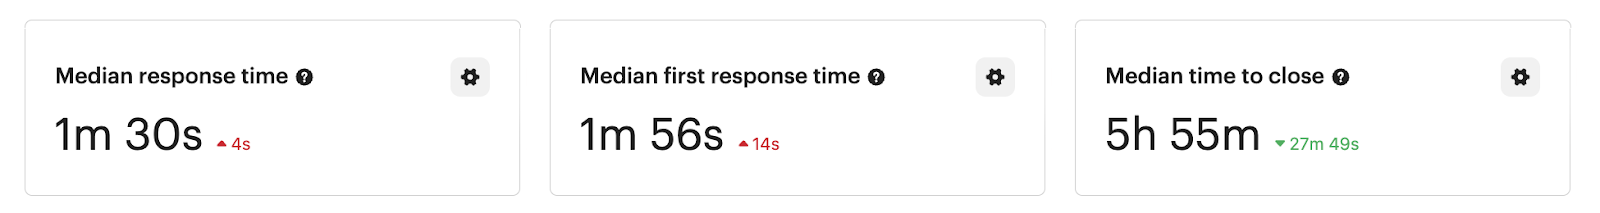
The main responsiveness metrics include median or average response time, first response time, and ticket resolution time.
8. First response time
This indicates how long customers wait for your team to reply to their initial message. If it falls behind your service level objective, you may need to allocate more resources to handle new conversations promptly.
9. Response time
Median response time measures how quickly your team replies to customer messages overall, not just the first response. By identifying periods of low responsiveness, you can address gaps in your support coverage and enhance the customer experience by providing faster service.
10. Resolution time
Resolution time will show how quickly customer issues are resolved. While quick replies are essential, your customers also want their issues to be resolved efficiently. To improve resolution time consider investing in comprehensive documentation for your team and breaking down silos between departments when assistance from other teams is needed to address a specific customer request.
There is ongoing discussion within the support community regarding the aggregation method for these metrics. You can choose between:
- Average time is calculated by summing up all response or resolution times and dividing by the number of responses or tickets. For example, if you have four response times of 1, 2, 3, and 4 minutes, your average response time will be 2.5 minutes, calculated as the sum of all time (10 minutes) divided by the number of responses (4).
- Median time represents the middle value in all response or resolution times. For example, if you have 5 response times of 1, 2, 3, 4, and 5 minutes, your median response time is 3 minutes, which is the middle value.
While the average aggregation method provides a general overview, it can be influenced by outlier extremes. I personally prefer the media aggregation method as it offers a more balanced view of the team’s performance.
Analyzing individual response times enables you to identify team members who may require coaching to improve their efficiency. If response and resolution times consistently fall below targets for all team members, it may call for adjustments to workflow and headcount within your team.
What are the most important effectiveness metrics?
Effectiveness metrics provide insights into how efficiently your support team manages tickets over time. The most common effectiveness metrics include first contact resolution (FCR) rate and number of replies per ticket.
11. First Contact Resolution Rate
The FCR rate indicates the percentage of tickets that your team resolves with a single response, without engaging in a lengthy back-and-forth with customers.
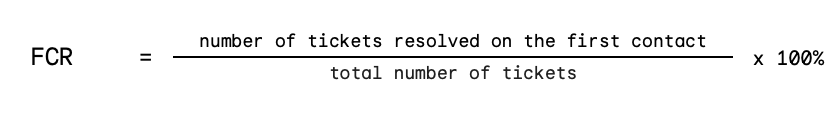
How to calculate the FCR rate
To calculate the FCR rate, divide the number of tickets resolved on the first contact by the total number of tickets, and then multiply the result by 100%.
The benchmark for the FCR rate typically falls around 70%. If you see a significantly lower percentage, you may have to revisit your assignment rules and ensure that customer inquiries are directed to the appropriate team from the outset.
12. Number of Replies per Ticket
This metric measures the number of replies your team sends on average to resolve a conversation.
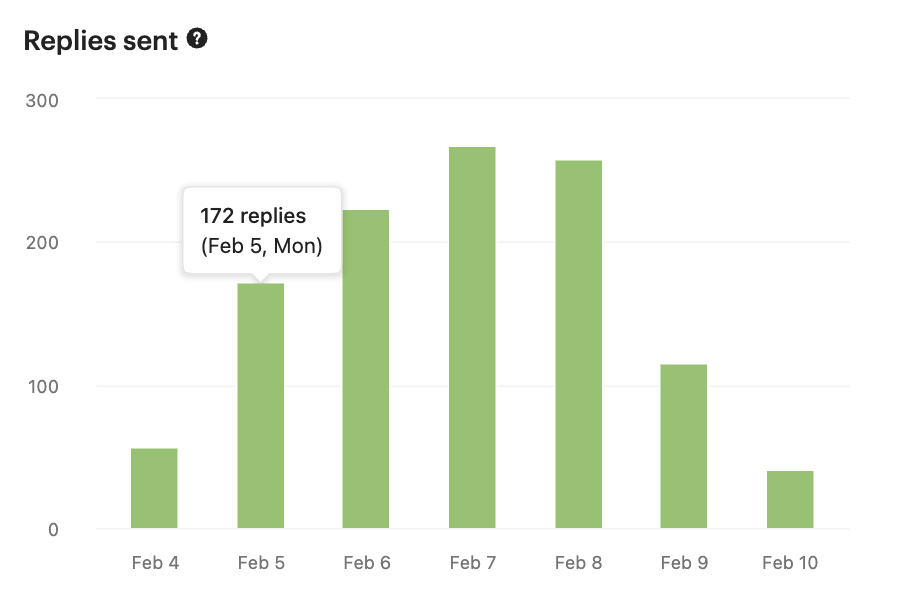
Tracking the median or average number of replies per ticket over time is a valuable tool for identifying potential product issues. If you detect any anomalies in your data over time, dig into conversation insights to pinpoint the reasons.
Perhaps a new release is causing customer confusion and you need better documentation to be able to address customer questions more efficiently and reduce the need for prolonged back-and-forth.
What are the most important self-service metrics?
As you evaluate the performance of your human customer service agents, it’s essential to also consider the effectiveness of your self-service channels, where you invest resources as well.
Self-service metrics provide insights into the effectiveness of your help center, bot flows, and other self-service channels. The primary self-service metrics include the self-service score and the deflection rate for chatbots and AI assistants.
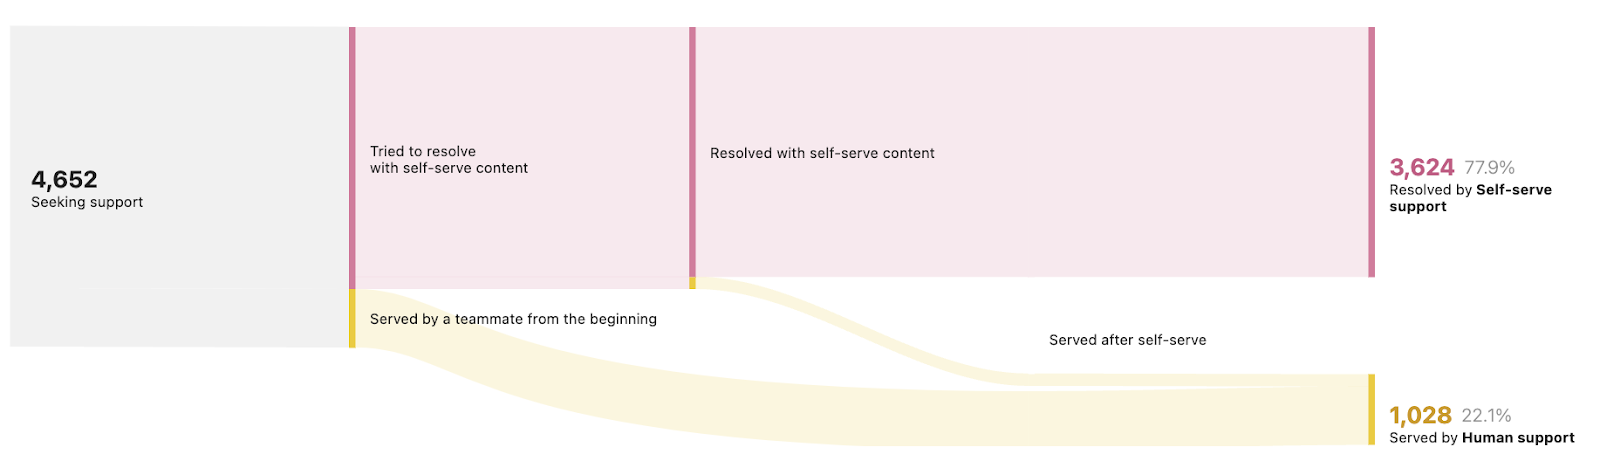
Screenshot from Intercom
13. Self-Service Score
The self-service score offers insight into the performance of your customer-facing content and signals when it’s time to improve it. It shows how many customers were able to find answers independently without the need to contact your support team directly.
How to calculate the self-service score
To calculate your self-service score, determine the ratio of all help center visitors compared to the number of customers who open support tickets from the help center pages.
- Example: If you had 50 help center visitors in the past week, and 10 of them opened support tickets, your self-service score would be 5:1, suggesting that for every 5 help center visitors, 1 customer creates a ticket.
Zendesk has defined 4:1 as the benchmark score across all industries. You can refine your content based on related support inquiries and optimize your help center structure to improve your score.
14. Bot Deflection Rate
Also known as the resolution rate, this metric indicates the percentage of customers who did not require human assistance after interacting with your chatbot or AI assistant.
Assuming customers stop interaction because they get satisfying resolutions, the deflection rate allows you to measure the effectiveness of chatbots and AI automation.
The benchmark for deflection rate typically stands around 50%.
You can enhance this metric by analyzing conversations that require a human touch and training your chatbot to handle more use cases over time.
Get beyond the numbers
As the saying goes, “If you can measure it, you can manage it.” Tracking the right customer service metrics is critical to ensure that your team is going in the right direction, driving customer loyalty and retention.
But what’s equally important is maintaining a robust internal knowledge base that your team members can refer to when tackling customer tickets. Tettra’s internal knowledge base software helps with this exact challenge, empowering your customer-facing teams with quick and efficient access to the knowledge they need.
With a single, centralized source of truth for your support teams, you can up your customer service game and delight customers.
If you’re ready to equip your team for the best performance, start a free trial of Tettra today.
Maryna is a results-driven CX executive on a mission to champion efficient and human-centric customer support. With a deep-rooted passion for well-structured documentation, she firmly believes that exceptional customer experiences lie at the heart of every successful business.